
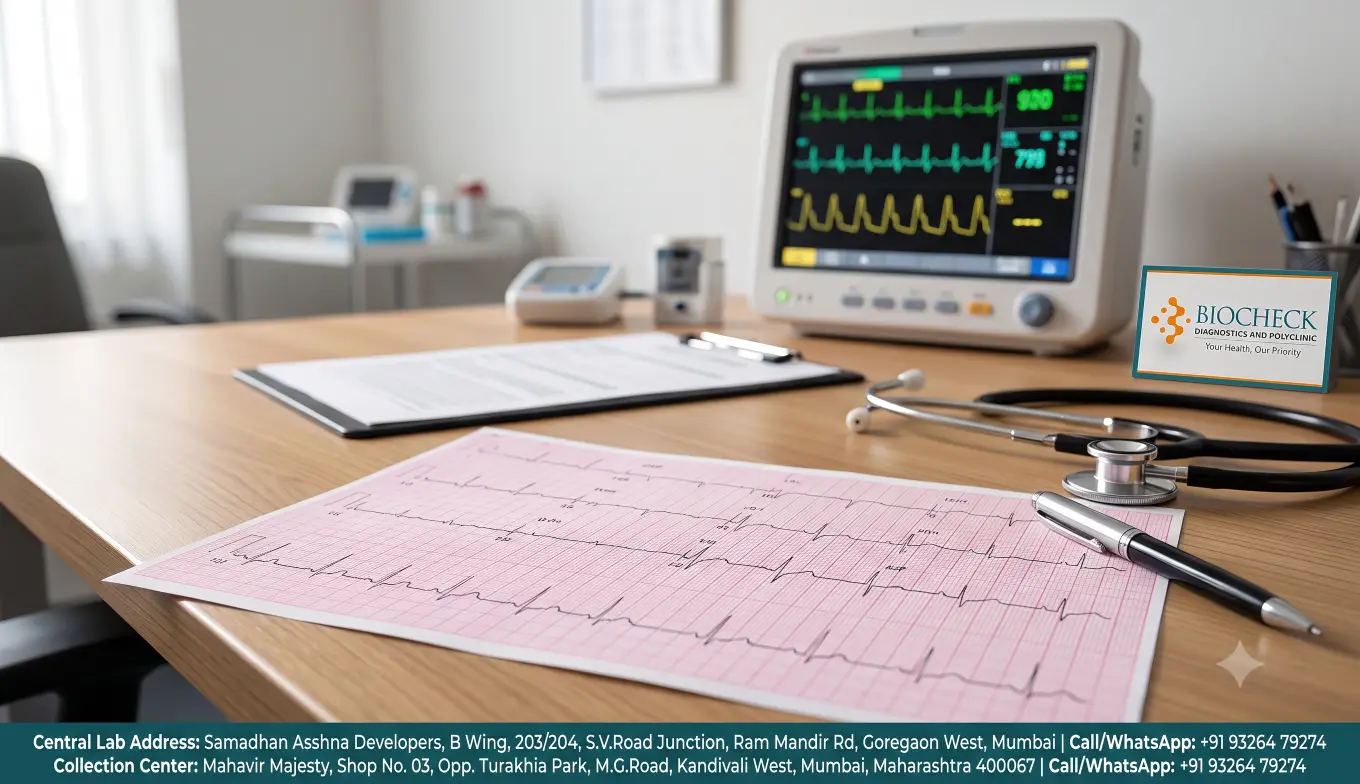
You step into a clinic after experiencing sudden palpitations during a stressful workday, or perhaps your doctor ordered a routine cardiac checkup as part of an annual health assessment. The technician connects small electrode stickers to your chest, arms, and legs. Within two minutes, the machine prints out a strip of pink grid paper covered in sharp peaks, dips, and rhythmic waves.
Your doctor glances at it for thirty seconds and notes whether your rhythm is normal. But when you hold the report yourself, it feels like looking at an indecipherable code. What do those squiggly lines mean? What does "Sinus Rhythm" stand for? And when does a spiked line indicate an actual problem?
An Electrocardiogram (ECG or EKG) remains one of the fastest, safest, and most effective diagnostic tools in modern cardiology. It records the electrical impulses that trigger every single heartbeat. While a clinical diagnosis must always be confirmed by a qualified physician or cardiologist, understanding the basic anatomy of an ECG tracing helps demystify the test, reducing anxiety and empowering you to take proactive control of your cardiovascular wellness.
The human heart is an electromechanical pump. Before any heart muscle can contract and pump blood to your brain and body, an electrical signal must travel across its chambers:
The Upper Chambers (Atria): Collect blood returning to the heart.
The Lower Chambers (Ventricles): Pump blood out into the lungs and the rest of the body.
The natural pacemaker of your heart—the Sinoatrial (SA) node located in the right atrium—generates tiny electrical impulses. These impulses travel through specialized conduction pathways, causing the muscle fibers to depolarize (contract) and repolarize (relax and reset).
An ECG machine does not send electricity into your body; it simply acts as an ultra-sensitive listening device. The electrodes detect these microvolt electrical signals moving through your chest tissue and plot them over time on standardized graph paper.
If you look closely at your ECG tracing, you will notice a grid of tiny squares grouped inside larger, darker squares:
Horizontal Axis (Time): Standard ECG paper moves at a constant speed of 25 millimeters per second.
Each small 1 mm box represents 0.04 seconds (40 milliseconds).
Each large 5 mm box represents 0.20 seconds (200 milliseconds). Five large boxes equal exactly one second.
Vertical Axis (Voltage/Amplitude): Measures the electrical strength of the signal.
Each small 1 mm box represents 0.1 millivolts (mV).
Two large vertical boxes (10 mm) represent 1.0 mV.
Cardiologists count these tiny squares to calculate your exact heart rate, measure how long it takes for electrical signals to travel between chambers, and determine whether the heart muscle has grown abnormally thick.
Every standard heartbeat cycle on an ECG consists of five distinct wave deflections named arbitrarily with letters: P, Q, R, S, and T.
Plaintext
       R
      / \
 P   /   \     T
/\  /     \   /\
  \/       \/
   Q        S
The first small, smooth bump is the P Wave. It represents atrial depolarization—the electrical impulse spreading across the top two chambers of the heart, causing them to contract and push blood down into the ventricles.
Normal appearance: Smooth, rounded, and upright in most leads.
What doctors look for: If the P wave is notched or tall, it may suggest atrial enlargement. If it is completely missing and replaced by irregular, chaotic squiggles, it is the classic hallmark of Atrial Fibrillation (AFib).
This is the flat baseline section measured from the beginning of the P wave to the start of the QRS complex. It represents the tiny, vital fraction of a second where the electrical signal pauses at the Atrioventricular (AV) node. This pause ensures that the ventricles have enough time to fill completely with blood before they pump.
Normal duration: 0.12 to 0.20 seconds (3 to 5 small boxes).
What doctors look for: A prolonged PR interval indicates an electrical conduction delay, commonly referred to as a Heart Block.
The sharpest, tallest spike on the tracing is the QRS Complex. It represents ventricular depolarization—the powerful electrical storm that triggers your ventricles to contract and pump blood out through the aorta and pulmonary arteries.
Q wave: The initial downward dip before the spike.
R wave: The tall, steep upward spike.
S wave: The downward dip immediately following the R wave.
Normal duration: 0.08 to 0.12 seconds (under 3 small boxes). It should be narrow and sharp.
What doctors look for: A wide, sluggish QRS complex suggests that the electrical signal is traveling abnormally, often seen in Bundle Branch Blocks or ventricular arrhythmias. Abnormally tall R waves can indicate Left Ventricular Hypertrophy (LVH), a sign that the heart muscle has thickened from chronic, untreated high blood pressure.
The flat line that connects the end of the S wave to the start of the T wave is the ST Segment. This segment is perhaps the most closely scrutinized part of the entire tracing in emergency rooms.
Normal appearance: Flat along the baseline (isoelectric).
What doctors look for:
ST Elevation (STEMI): When this line curves upward like a tombstone, it indicates acute, severe myocardial injury—a major heart attack requiring immediate intervention.
ST Depression: When the line sags below the baseline, it often points to myocardial ischemia, meaning the heart muscle is not receiving sufficient oxygenated blood due to narrowed coronary arteries.
The rounded upward bump following the QRS complex is the T Wave. It represents ventricular repolarization—the electrical recovery phase where the heart muscle cells reset their internal ions (sodium and potassium) to prepare for the next contraction.
What doctors look for: Inverted (upside-down) T waves can indicate ischemia or strain. Exceptionally tall, peaked, tent-like T waves are a classic diagnostic sign of hyperkalemia (dangerously high blood potassium levels).
Modern automated ECG machines automatically print an algorithmic interpretation at the top of the page. Seeing unexpected medical terms can cause unnecessary worry. Here is what the most frequent findings actually mean:
Normal Sinus Rhythm: The gold standard. The electrical signal originates normally from the SA node, fires at a regular pace (between 60 and 100 beats per minute), and follows the correct pathways.
Sinus Bradycardia: The heart is beating slower than 60 beats per minute. While this can point to conduction issues, it is also completely normal in endurance athletes, long-distance runners, or individuals resting deeply.
Sinus Tachycardia: The heart rate exceeds 100 beats per minute while maintaining a normal electrical pathway. This is commonly triggered by physical exertion, anxiety, fever, dehydration, or excess caffeine consumption.
Premature Ventricular Contractions (PVCs) / PACs: Early, extra heartbeats that feel like a "skipped beat" or sudden flutter in your chest. Isolated PVCs are common and often benign, particularly in individuals facing high work stress or sleep deprivation.
Non-Specific ST-T Wave Changes: Minor fluctuations that do not fit a neat diagnostic category. They are often harmless variations, but doctors use them as a prompt to correlate with clinical symptoms or check blood biomarkers.
An ECG provides an instantaneous snapshot of your heart's electrical system while you are lying still on a table. However, it has clear clinical limitations:
It does not show active blood flow: A resting ECG can be completely normal even in an individual with significant coronary artery blockages, provided the heart is not actively stressed at that exact moment.
It does not show structural valve function: An ECG cannot assess whether your heart valves are leaking or clicking properly. For structural evaluation, cardiologists rely on a 2D Echocardiogram (Echo), which uses ultrasound to visualize heart chambers, wall motion, and blood flow in real time.
It pairs best with blood biomarkers: To gain complete cardiovascular visibility, an ECG is best evaluated alongside advanced laboratory markers like Apo-B (atherogenic particle count), hs-CRP (vascular inflammation), and a comprehensive Lipid Profile.
If you have been feeling unexplained chest heaviness, persistent palpitations, sudden breathlessness during stairs, or simply want to complete a thorough annual checkup, obtaining a clear diagnostic baseline is vital.
At Biocheck Diagnostics, our diagnostic workflow is designed to give you clinical certainty:
For Electrocardiograms & Advanced Scans: Specialized non-invasive cardiac and pulmonary diagnostics—including Resting 12-Lead ECGs, 2D Echo, and Digital Chest X-Rays—are conducted at our Central Laboratory & Polyclinic located at S.V. Road Junction, Goregaon West (near Ram Mandir Road). Our equipment produces clean, high-resolution tracings verified by senior physicians and M.D. Radiologists.
For Complementary Blood Tests: If you need routine or advanced cardiovascular panels (such as Lipid Profiles, Electrolytes, Apo-B, or Kidney Function), you can visit our dedicated Pathology Collection Center at Shop No. 3, Mahavir Majesty (opposite Turakhia Park in Dahanukar Wadi, Kandivali West) or schedule our reliable Home Sample Collection service across Malad, Borivali, and Kandivali.
Do not try to self-diagnose an ambiguous tracing from an online search. If your ECG flags an irregularity, discuss the findings with your doctor and get comprehensive testing to protect your long-term heart health.
Available Near You
Whether you’re in Malad, Goregaon, Jogeshwari, Andheri or any part of Mumbai, BIOCHECK Diagnostics & Polyclinic is your trusted local centre for ECG and comprehensive ECG services.